


Sociodemographic characteristics of the respondents
The ages distribution of respondents was balanced, with the females representing a slightly higher proportion, accounting for 58.5% of non-orthodontic patients and 62.0% of orthodontic patients being female. Table 1 presents the sociodemographic characteristics of the respondents. A chi-square test was created to analyze the relationship between sociodemographic factors (including age, gender, and educational level) and the decisions to pursue orthodontic treatment. The study found no significant statistical difference between genders regarding the decision to undergo orthodontic treatment. However, respondents aged 10–18 years, students with a senior high or below, and those with prior dental experience were more likely to opt for orthodontic treatment (Table 1).
Further analysis using binary logistic regression revealed that age, dental experience, and occupation independently influenced the decision to seek orthodontic treatment (p < 0.05). Specifically, respondents aged 10–18 years were more likely to undergo orthodontic treatment compared to those over 30 years. Individuals with a history of dental treatment were 2.4 times more likely to seek orthodontic care than those without dental experience. Additionally, students and corporate employees were 2.17 times and 1.7 times more likely to receive treatment, respectively, compared to farmers and self-employed respondents (Table 2).
Knowledge of respondents about orthodontic treatment
Overall, the majority of respondents answered all six knowledge questions correctly (Table 3). A significant 88.9% of respondents were aware that orthodontic treatment can straighten teeth, 71.2% knew that genetic factors may cause misaligned teeth, and 79.8% understood which types of patients typically require treatment. Interestingly, only 45.4% knew the best age for orthodontic treatment, and 78.9% recognized that misaligned teeth can cause bite issues and other oral health problems.
To explore differences in knowledge between orthodontic and non-orthodontic groups, independent samples t-tests and one-way ANOVA were performed, followed by LSD post-hoc tests. In both groups, gender, age, education level, and dental experience significantly influenced knowledge (p < 0.05, Fig. 2). Specifically, females, individuals aged 18–30 years, and those with higher education or prior dental experience scored higher. Students and corporate employees also demonstrated significantly higher knowledge than farmers or self-employed individuals. However, a key difference between the two groups is that, in the non-orthodontic group, occupation was also a significant factor affecting knowledge, with students and corporate employees showing higher scores than others (Fig. 2A). In contrast, occupation had no significant effect on knowledge in the orthodontic group (Fig. 2B).
Multiple linear regression analysis revealed that in the non-orthodontic group, gender, occupation, and dental experience were significant predictors of orthodontic knowledge (p < 0.05, Table 4). Females scored 0.269 units higher than males, and students and corporate employees scored 0.884 and 0.616 units higher than farmers and self-employed individuals, respectively. However, in the orthodontic treatment group, only gender and dental treatment history had significant independent effects on knowledge (p < 0.05, Table 5), with females scoring 0.429 units higher than males and individuals with prior dental treatment scoring 0.525 units higher than those without.

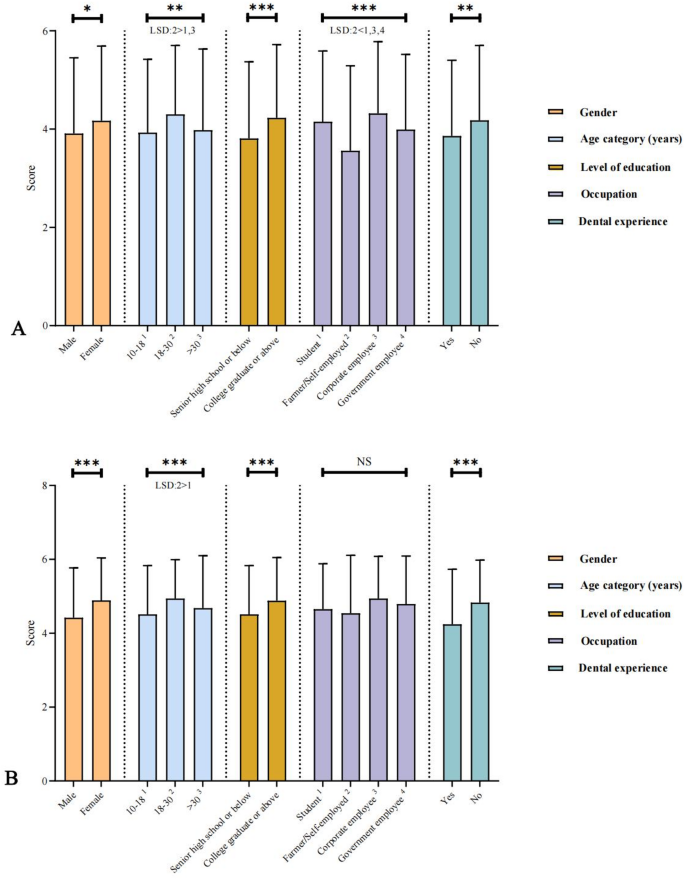
Relationship between sociodemographic characteristics and knowledge levels among respondents. (A) Non-orthodontic respondents; (B) Orthodontic patients. Statistical analyses were performed using independent t-tests and one-way ANOVA (LSD post-hoc tests) comparisons. Statistical significance is indicated as *(P<0.05), **(P<0.01), ***(P<0.001)
Attitudes of respondents toward orthodontic treatment
Overall, respondents exhibited a positive attitude towards orthodontic treatment. A majority of all respondents (81.2%) felt that they had a malocclusion problem. Nearly half of non-orthodontic patients have thoroughly considered orthodontic treatment (48.2%) and believed that orthodontic treatment was not high-risk treatment (48.8%). Among orthodontic patients, 84.2% were willing to undergo long-term treatment to achieve ideal results, and 82.5% felt that the cost was worthwhile. The overwhelming majority (92.8%) had positive expectations for aesthetic outcomes, and 91.1% would recommend orthodontic treatment to family or friends (Table 6).
Concerns and expectations regarding orthodontic treatment were similar across both groups, with the long treatment duration being the main concern (53.23%). Cost and pain were also frequently mentioned, particularly by non-orthodontic respondents (Fig. 3A) The majority of respondents, especially orthodontic patients, expected orthodontic treatment to improve both tooth alignment and facial aesthetics (Fig. 3B).
When examining sources of information, dental professionals were the main source for orthodontic respondents (54.87%), followed by online, newspaper, TV, or radio media (33.16%). School education accounted for a small portion (4.81%, Supplementary File 2).

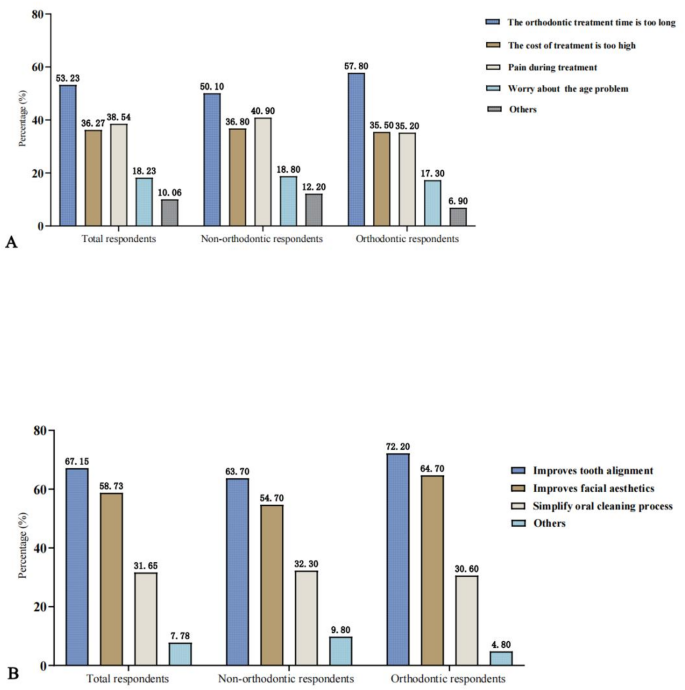
Comparison of attitudes toward orthodontic treatment between non-orthodontic respondents and orthodontic respondents: (A) concerns about orthodontic treatment, (B) expectations for orthodontic treatment
Practices of orthodontic patients during orthodontic treatment
Orthodontic patients generally showed high compliance during treatment (Fig. 4). 71.4% consistently used orthodontic toothbrushes and auxiliary cleaning measures, and 72.8% followed their orthodontist’s daily oral hygiene advice. Furthermore, 65.8% adhered to the recommended dietary changes, and 87.2% attended follow-up appointments on time. However, 11.9% frequently encountered issues like broken appliances or wire displacement, while 25.9% never experienced these problems.
Notably, a small proportion of patients exhibited poor compliance with treatment recommendations. For example, 2% of patients never used orthodontic toothbrushes or auxiliary cleaning measures, and 0.2% ignored daily oral hygiene advice from their orthodontists.
To further investigate the influence of sociodemographic factors on respondents’ orthodontic treatment practices, independent sample t-tests, and one-way ANOVA were performed (Fig. 5A). The results indicated significant differences in treatment practices by age and education level. The mean values show that patients with a senior high school or below education had significantly higher average scores in treatment practices compared to those with a college graduate or above degree. LSD post-hoc tests further showed that the 18–30 age group had significantly higher average scores in treatment practices than both the 10–18 and over-30 age groups.

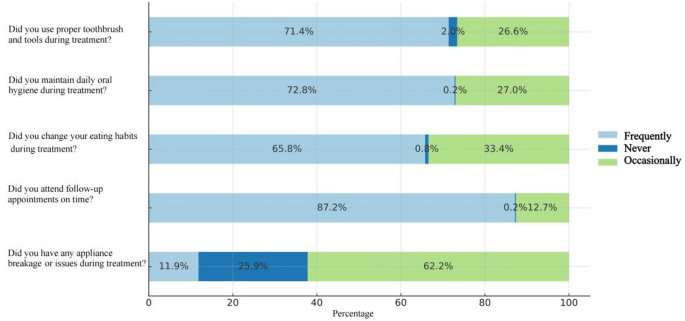
Orthodontic patients’ compliance with orthodontic treatment practices. Percent frequency of five core behaviors
Satisfaction of orthodontic patients with orthodontic treatment
Knowledge, attitudes, and practices of respondents greatly influence orthodontic treatment outcomes, which in turn are the key determinants of patient satisfaction. To explore this further, we conducted a satisfaction survey (Table 7). Overall satisfaction with orthodontic treatment was high, with 40.3% of patients being “very satisfied” and 56.1% reporting general satisfaction. Only 3.6% were dissatisfied. Satisfaction with orthodontists was even higher: 73.9% were “very satisfied,” and 24.5% expressed general satisfaction.
Pain was a significant factor influencing satisfaction, with 86.1% of patients finding it tolerable, 12.5% experiencing no pain, and only 1.4% considering it unbearable. Speech difficulties were common early in treatment, with 75% reporting issues, but most adjusted over time; however, 4.5% did not. Social activities were affected in 27.2% of patients, while 72.8% reported no impact from wearing braces.
Further analysis of the reasons for patient dissatisfaction with orthodontic treatment (Table 8) revealed that the most common issues were long waiting times (22.4%) and friction or mouth ulcers caused by the appliances (21.2%). Long treatment duration (16.3%) and frequent follow-up appointments (6.4%) were also considered factors affecting satisfaction. The main reasons for dissatisfaction with orthodontists were accidental injuries to the lips and tongue mucosa during the procedure (29.5%) and the orthodontist’s unwillingness to address questions (21.6%, Table 9).
Independent sample t-tests and one-way ANOVA revealed statistically significant differences in treatment satisfaction based on gender, education level, occupation, and age (p < 0.05), whereas dental treatment history did not show a significant difference (Fig. 5B). LSD post-hoc tests revealed that the 10–18 age group had significantly higher satisfaction scores compared to the 18–30 and over 30 age groups. As for occupation, the student group scored significantly higher than the farmer or self-employed and corporate employee groups. For gender, males had significantly higher average treatment satisfaction scores compared to females. Regarding education level, individuals with a high school education or below had significantly higher satisfaction scores compared to those with a university degree or above.

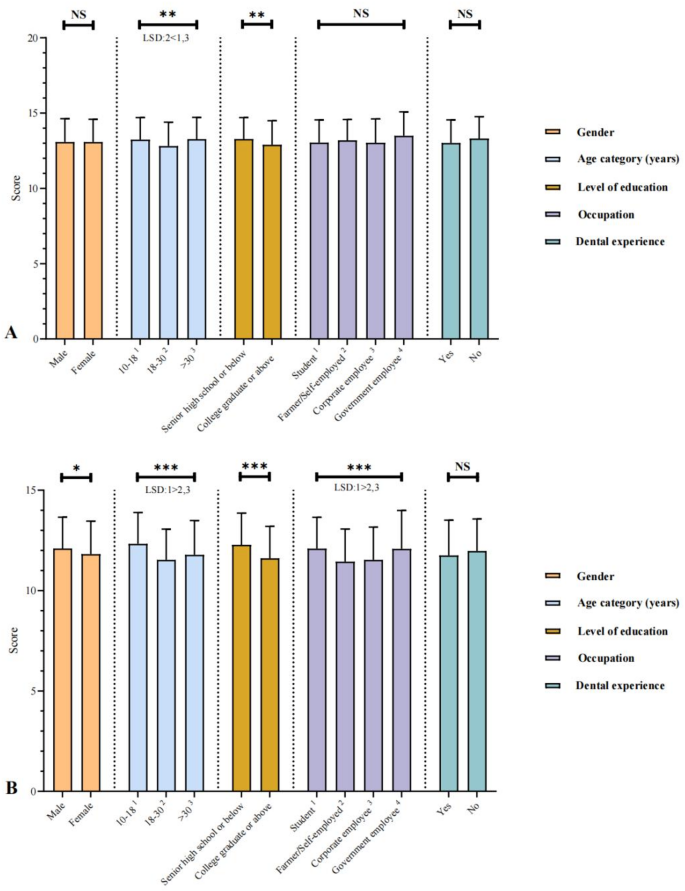
Associations between the sociodemographic characteristics of orthodontic patients and their orthodontic treatment practices and satisfaction. (A) Orthodontic treatment practices; (B) Orthodontic treatment satisfaction. Statistical analyses were performed using independent t-tests and one-way ANOVA (LSD post-hoc tests) for multiple comparisons. Statistical significance is denoted as *(P<0.05), **(P<0.01), ***(P<0.001)
link